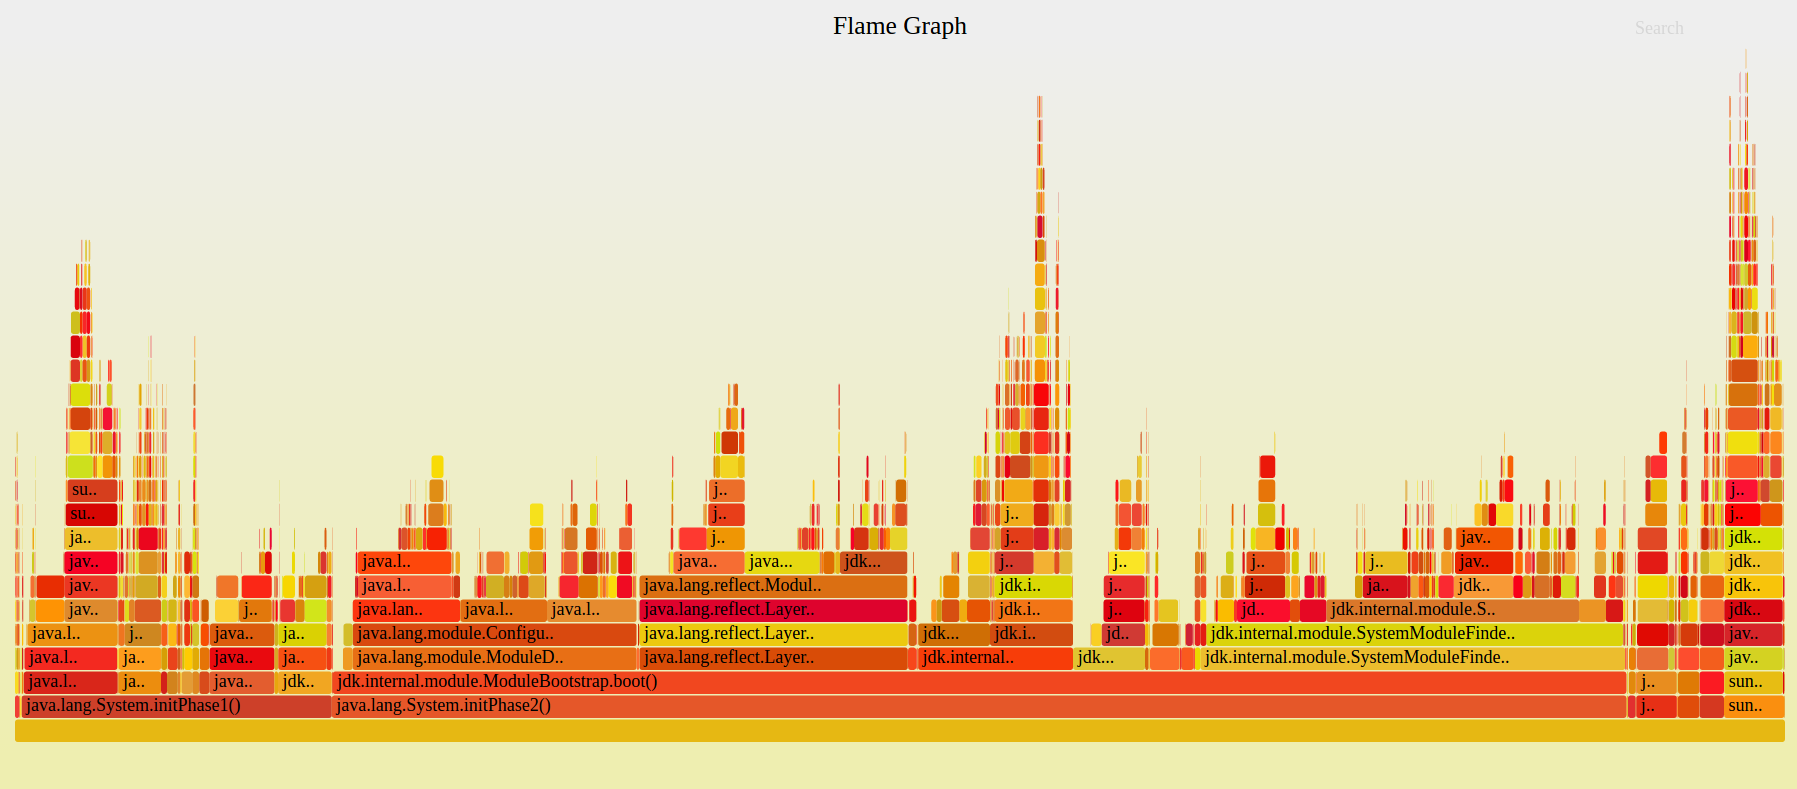
A tool to turn the output of -XX:+TraceBytecodes (a JDK debug-only feature to print every bytecode executed by the interpreter) into a simple stack format, and a script to turn that into flame graphs showing what happened during program execution, bytecode-by-bytecode:
This is a diagnostic tool I've developed and used to visualize what is going on at startup at a high granularity. Since it relies on a very verbose and slow debug option it's not by any means a good estimator of how long time things actually take.
As such, this is more a diagnostic tool than a profiler, but a tool that has served us well to disentangle various startup dependencies and inefficiencies in the JDK itself - and been a valuable aid in diagnosing a number of startup regressions.
Most profiling tools either have a blind spot when it comes to capturing what happens during the very early initialization of a JVM, e.g., agent based instrumentation, JFR etc, or they are native profiling tools that would attribute everything to "something in the interpreter".
-XX:+TraceBytecodes, e.g.:java -XX:+TraceBytecodes HelloWorld > helloworld
./trace.sh helloworldhelloworld.svg in your favorite SVG viewer-Xint, since
as things start to get compiled they will disappear from view...